X-Ray
Financial health for 1,286 companies read from their banking trail, with early warning and scenario simulation.
- Role
- Front end & product · team of 5
- Status
- Archived
- Video
- youtu.be/ojYzNzDsO74
A company doesn't go under on its balance sheet. It goes under on cash.
36 hours, five people and 24 months of bank movements to answer a single question: can money tell you how a company is doing?
Classic solvency models lean on annual balance sheets and accounting ratios that arrive months late. By then the decision is already made — or it's already too late.
The challenge came down to a paradox: at month 24, two companies in the dataset score almost the same — 65 and 68 — but one has been climbing from 45 and the other falling from 82. A still photo can't tell them apart; one is the best bet of the year and the other an imminent risk.
What was needed was reading the trajectory, not the portrait: separating a one-off cash squeeze from structural decline, and being able to explain every point of the score without a black box.
App Router and strict TypeScript. Two audiences on one engine: Embat sees its client book, a company sees only itself.
The contract between engine and screen. If the backend changes a score factor, the front end won't compile until it knows.
The scoring engine: continuous transforms calibrated on working-capital physics, not a classifier with no labels.
A thin REST layer with Pydantic v2 over the engine: profile, history, sector benchmark, groups and counterfactual simulation.
A 400 MB embedded columnar store. 30,000 monthly slices queried in under 10 ms, with no external infrastructure.
The product video isn't a mockup: the real front-end components run inside the composition.
A continuous 0–100 score with exact additive decomposition: the bars add up to the change in the number, with no residual.
Early warning: catches the company that's turning while its score still looks healthy, a median of eight months ahead.
Six analytical states that separate a one-off bump from structural decline instead of firing on every bad month.
Counterfactual simulator: eight operating levers ranked by impact in points and in euros of cash freed.
Intra-group flow map inferred from a dataset that never says who pays whom, by matching amounts, dates and entities.
Holding consolidation with a contagion penalty when a subsidiary drops into critical territory.
A proactive monitor that alerts by email and Telegram with the causal breakdown of the change.
A conversational agent over an internal MCP, scoped to the company and its group.
Click to expand.
The challenge CSVs are ingested into an embedded DuckDB that acts as the single source of truth. On top, a Python scoring engine processes monthly panels causally — point-in-time, no lookahead bias — and precomputes states, levers and scenarios. FastAPI exposes them over REST, and the Next.js front end paints two different products on the same API: the client book for Embat and the company profile for the company itself. The forecasting module sits apart, as a testbed for models at 1, 3 and 6 months.
The decision that taught me most was not training a model: the dataset had no default label, so a classifier would have meant inventing the target and dressing it up as science. Giving up ML where it didn't belong — and keeping it for forecasting, which did have a measurable time series — was worth more than any architecture.
Links
Other projects
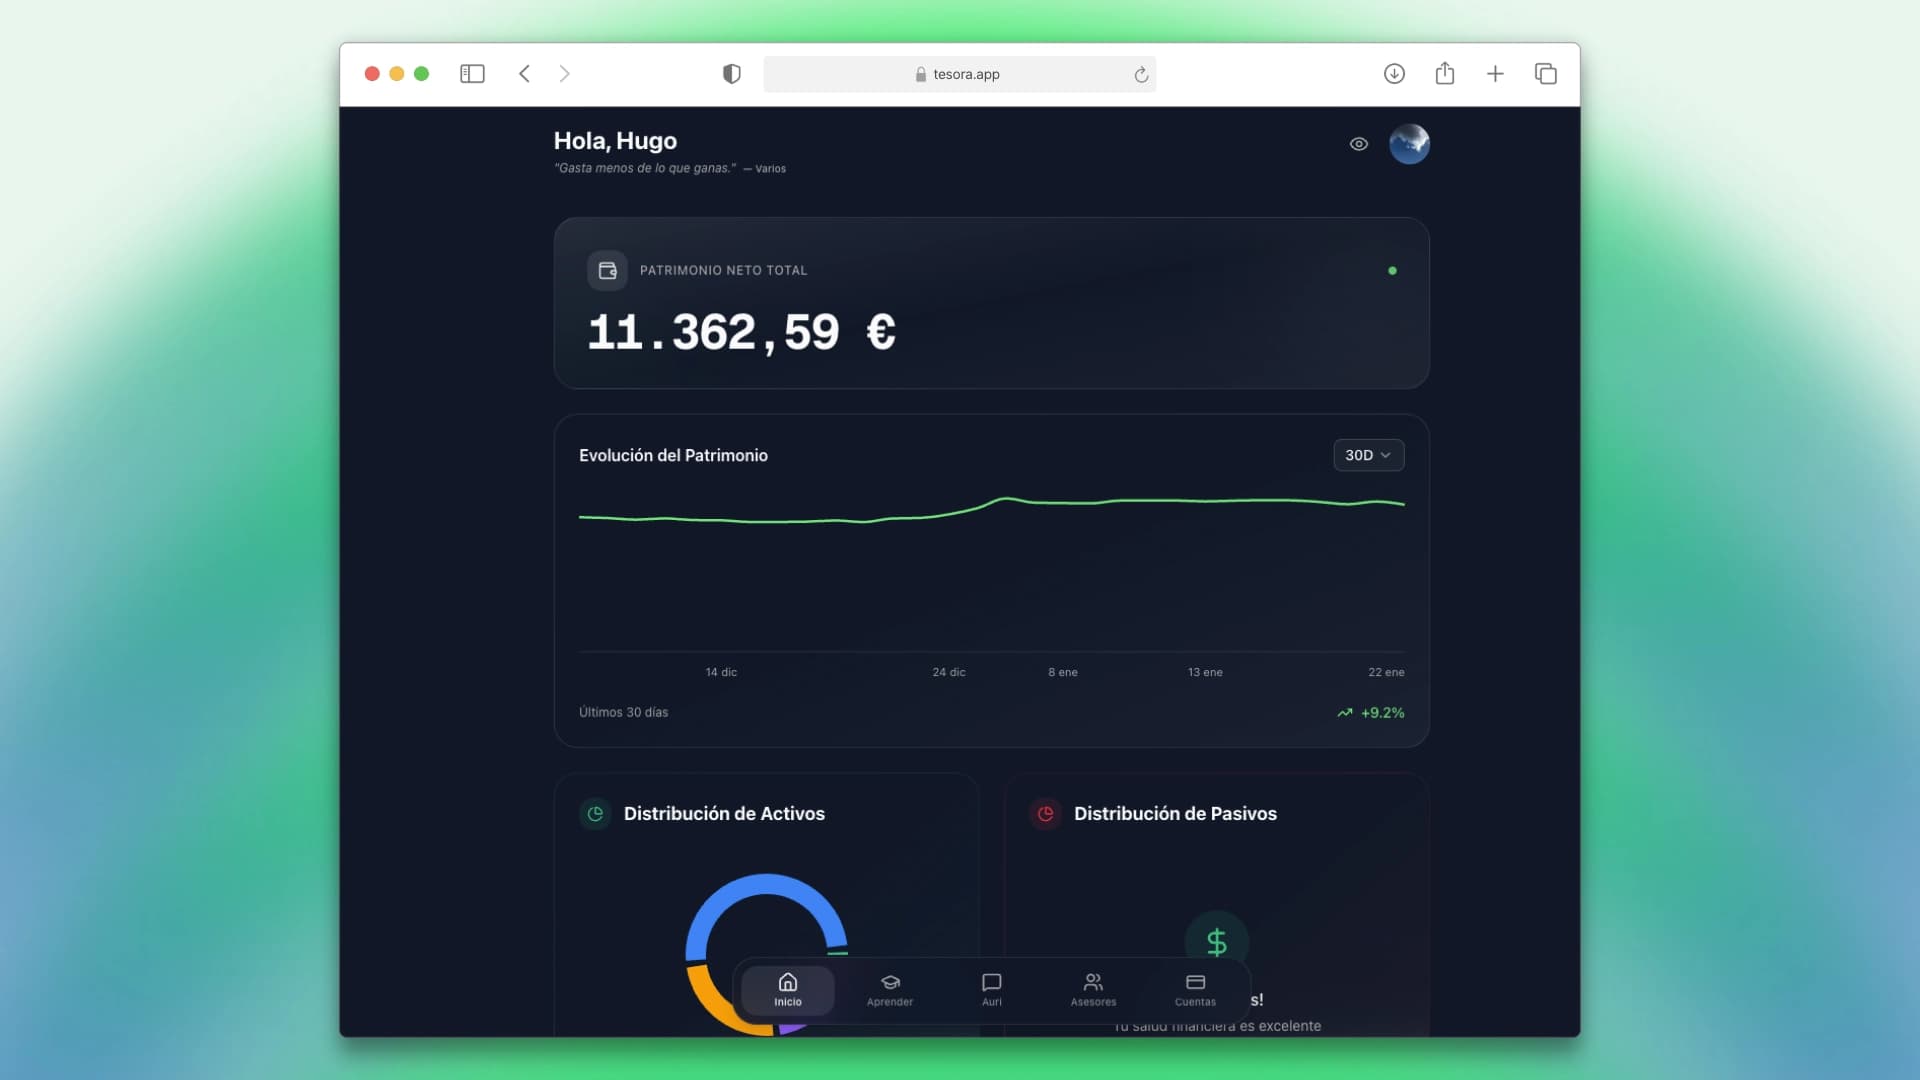
AI-powered personal finance: connect your banks, unify your wealth, get intelligent advice.

AI productivity assistant: centralize your tasks, projects and apps in a single personalized chat.
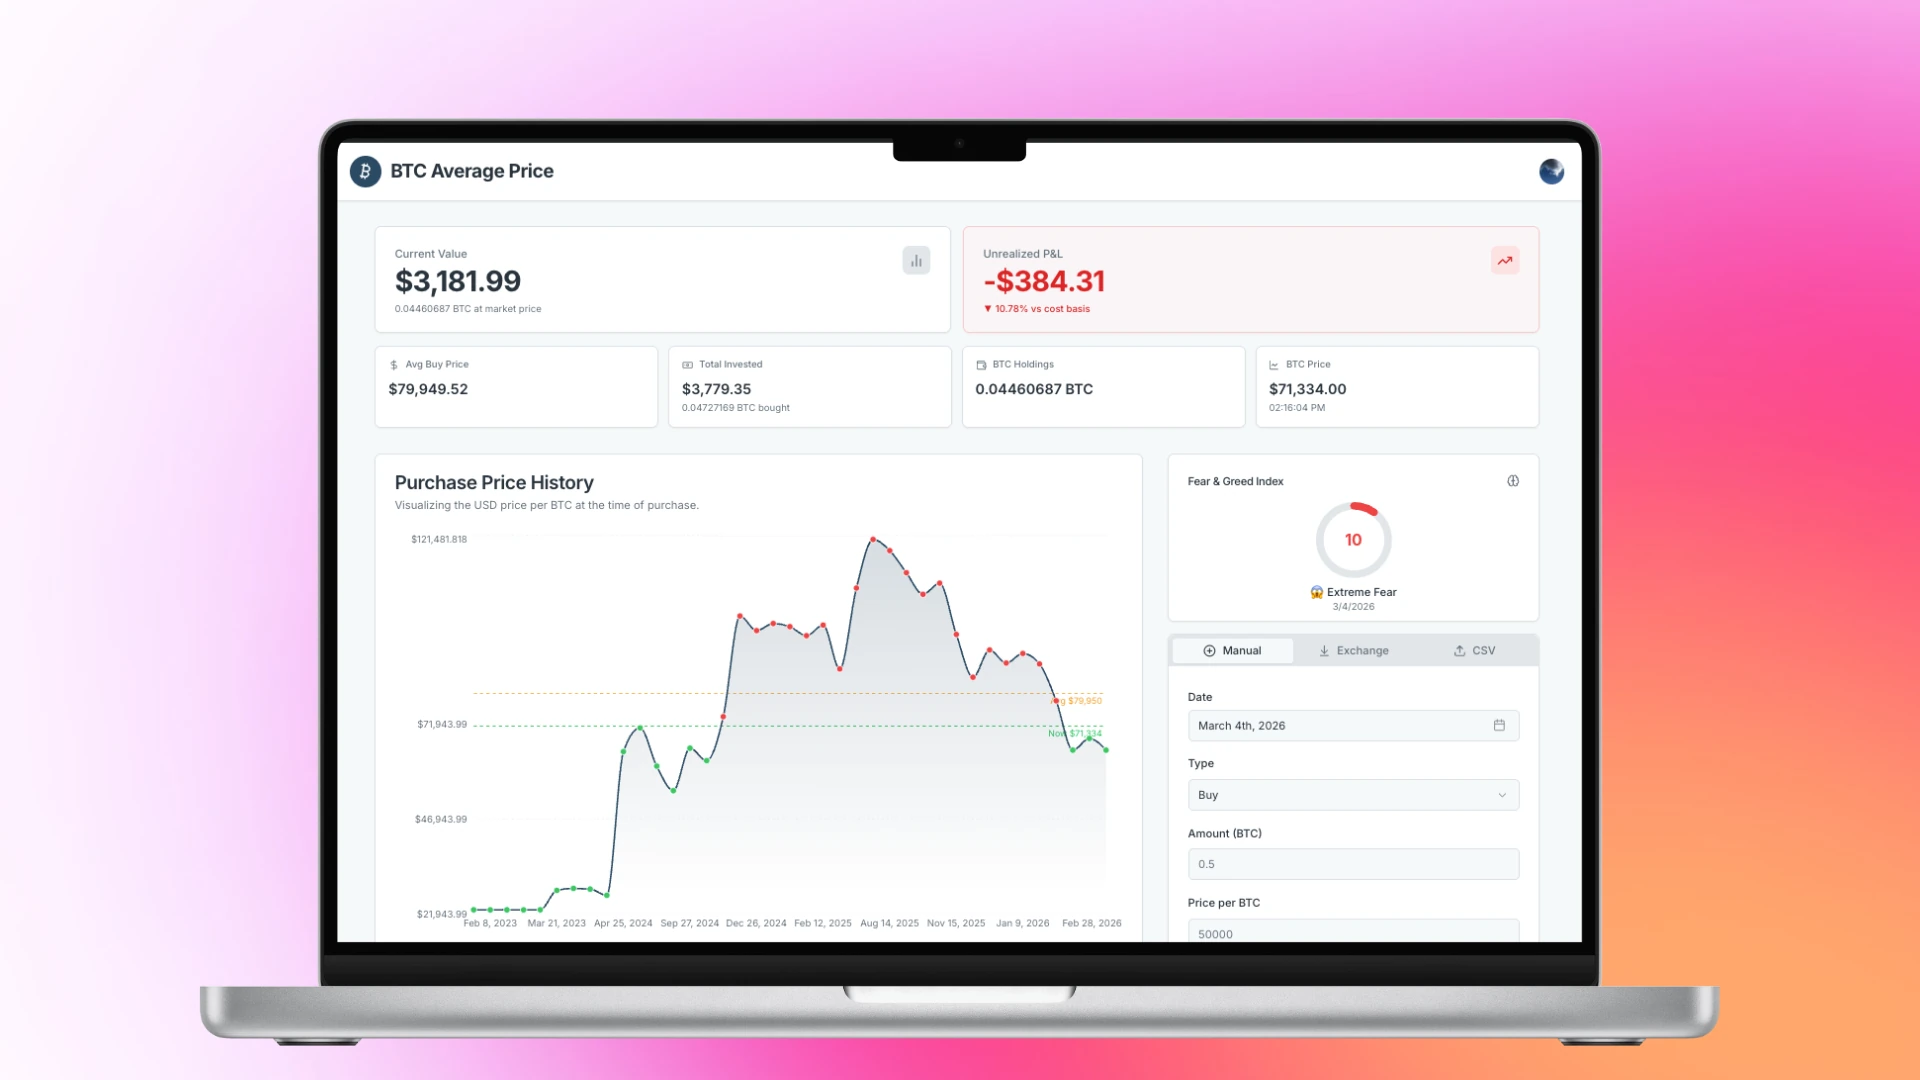
Bitcoin purchase calculator and tracker for average price, holdings and real-time P&L.